0 Koszyk 0,00 zł
Brak produktów
Darmowa wysyłka! Wysyłka
0,00 zł Razem
-
 Stock market chart on modern dubai background Podobne
 -
 Multi exposure of abstract virtual financial graph hologram on Los Angeles skyline background, forex and investment concept Podobne
 -
 Double exposure of financial graph on downtown veiw background. Concept of stock market research and analysis Podobne
 -
 Stock market graph with volume indicator in modern business Skyscraper, concept for stock trading and financial markets Podobne
 -
 Multi exposure of abstract virtual financial graph hologram on San Francisco skyline background, forex and investment concept Podobne
 -
 Abstract urban background in graphic style, geometric image of the city on a white background Podobne
 -
 Tops of glass and steel skyscrapers of downtown, UAE at sunny day. Building exteriors of the capital of the Emirate of Dubai. FOREX graph. Double exposure. A trading hub of Western Asia. Podobne
 -
 Stock market abstract background, economic and infographic concept Podobne
 -
 A graph showing a steep market downturn, casting a shadow over a city skyline Podobne
 -
 An active market chart represents the continuous growth of company stocks through a candlestick graph, graphically portraying the ascending journey of success and development in the corporate sector. Podobne
 -
 Finance chart,stock market business and exchange financial growth graph. Stock market investment trading graph growth. Podobne
 -
 Graphs and HUD interface in city Podobne
 -
 Futuristic cityscape - generative ai Podobne
 -
 Finance chart,stock market business and exchange financial growth graph. Stock market investment trading graph growth. Podobne
 -
 Sound Spectrum Analyzer Background Podobne
 -
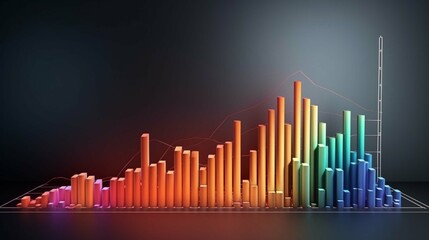 chart Podobne
 -
 Modern abstract city skyline: Vibrant and High-Energy Imagery of Modern Buildings in Architectural Blueprint Style, Showcasing Thin Steel Forms and Contemporary Glass Facades Podobne
 -
 Abstract virtual financial graph hologram on New York skyline background, forex and investment concept. Multiexposure Podobne
 -
 Abstract white background communication technology concept vector background Podobne
 -
 Panoramic view of financial charts Podobne
